Last modified 2025-10-03 |
Track Your Personal IDE Billing Expenses (Tutorial)
 | Abbreviations Key | |||
| AIFI | Allen Institute for Immunology | IDE | integrated development environment | |
| HISE | Human Immune System Explorer | USD | U.S. dollars |
At a Glance
This document explains how to track your personal and team IDE expenses. To minimize cloud billing costs, you should periodically compare your actual usage to your individual and team quotas. To learn which components contribute to your IDE costs and how to reduce them, see Understand HISE Billing. For billing questions, contact Support.
Instructions
To track your usage and compare it with that of other IDE users on your team, follow the steps below.
 Sign in
1. Navigate to HISE, and use your organizational email address to sign in.
2. Choose the accounts whose expenses you want to see. For instructions, see Accounts and Projects.
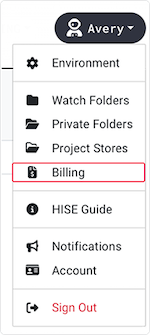
3. In the upper-right corner of your screen, click your name.
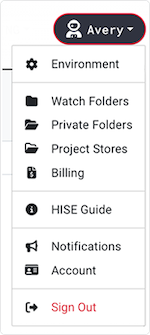
4. From the drop-down menu, choose Billing.
 Compare spending with quotas
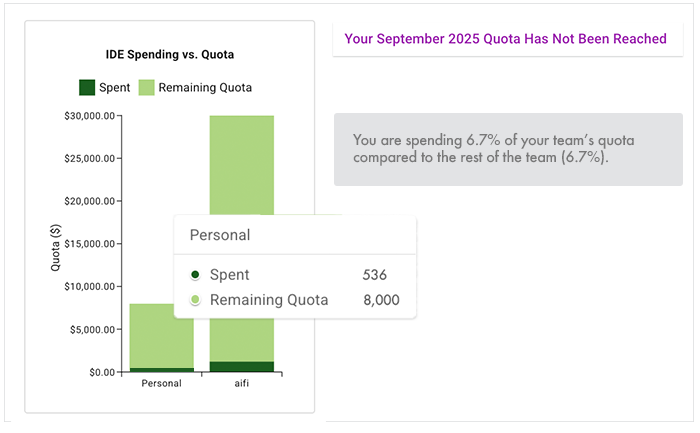
1. On the Billing page, click the Personal IDE Billing tab.
A. To learn what percentage of the team's quota you've spent (in this case, 6.7%), review the IDE Spending vs. Quota bar chart.
B. Review the spending summary in the gray box. This information might include your spending, your spending compared with your team's quota, or the median monthly spending for users on your team, depending on the available data.
C. Hover over the bar chart to see dollar amounts (in this case $536 of the $8,000 quota).
 Review relative resource consumption
1. Stay on the Personal IDE Billing tab, and scroll to the next section, Personal IDE and Private Folder Spend [Month Year].
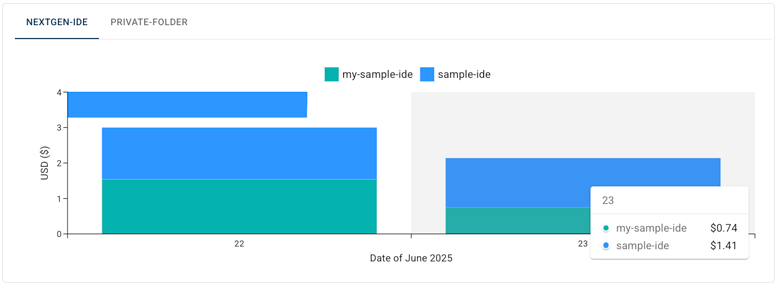
A. The first tab shows the names of your IDEs and the relative amount of resources (USD) each has consumed so far this month. Is this case, in the color-coded blocks, we see two IDEs, my-sample-ide and sample-ide, which have consumed roughly equal resources.
B. For a precise dollar amount, hover over a block, as shown in the right side of the image. Here, for example, on June 23, my-sample-ide-cost $0.74, and sample-ide cost $1.41.
C. To see the expenses incurred by your private folder, click the private-folder tab. This user has incurred no expenses.
 Review personal vs. partner spending
1. Stay on the Personal IDE Billing tab, and scroll to the next section, Total Personal vs. Median Partner Spending for the Last [X] Months.
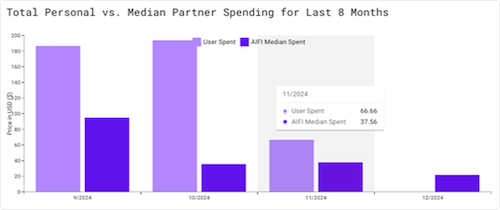
| The chart shows 12 months of billing data unless you've used HISE for < 1 year. For example, this user has used HISE for only 8 months. |
A. To compare your spending with the median amount spent by members of your team, review the bar chart.
B. To see the rough amount (USD) of your spending, look at the vertical axis.
C. For the precise dollar amount of spending in a single month, hover over the selected month. This user, for example, spent $66.66 in November, compared with median team spending of $37.56 the same month.
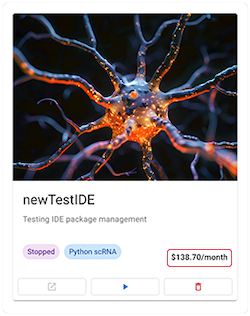
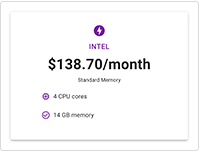
2. An alternative way to track IDE spending by instance is to go directly to the IDE:
A. From the top navigation menu in HISE, click RESEARCH.
B. From the drop-down menu, choose IDEs.
C. In the lower-right corner of the card for each running or stopped IDE, note the monthly spending (in this case, $138.70), or click the card for details.
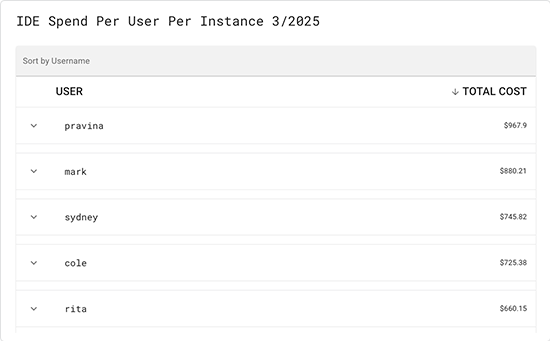
3. Scroll to IDE Spend Per User Per Instance:
A. To sort the list by username, click USER (left column).
B. To sort the list by dollar amount, click TOTAL COST (right column).
 Related Resources