Last modified 2025-10-13 |
Use the Cell Ranger Pipeline (Tutorial)
At a Glance
This document describes the HISE Cell Ranger pipeline, which converts flex RNA-seq data from Chromium experiments into analysis-ready formats for computation, visualization, and exploration in an IDE. For details on the 10x Genomics Cell Ranger platform itself, see the Cell Ranger documentation and release notes. If you have questions, contact Support.
 | Abbreviations Key | |||
| BAM | binary alignment map | HTML | hypertext markup language | |
| bc | barcode | MEX | market exchange format | |
| csv | comma-separated values | QC | quality control | |
| GEM | gel bead in emulsion | t-SNE | t-distributed stochastic neighbor embedding | |
| GEX | gene expression | UMAP | uniform manifold approximation and projection | |
| HDF5 | hierarchical data format, version 5 | UMI | unique molecular identifier | |
| HISE | Human Immune System Explorer | V(D)J | variable, diversity, and joining (gene segments) |
 Preprocessing
Cell Ranger v9.0.1 processes raw sequencing data from 10x Genomics Chromium experiments. This preprocessing occurs before the data is ingested into HISE. Nevertheless, it's helpful to understand what happens during this stage. The key steps are summarized in Table 1.
Table 1: Preprocessing steps
| Step | Description |
| Alignment and quantification | Aligns FASTQ files to a reference genome. Reads are assigned to cell barcodes and UMIs, and a feature-barcode matrix is generated using cellranger count (for individual samples) or cellranger multi (for multiplexed samples). |
| Cell calling | Identifies true cells among all detected barcodes using an algorithm that distinguishes real cells from empty droplets. |
| Feature barcoding | Outputs a feature-barcode matrix that includes gene expression counts and feature barcode counts for each cell. |
Quality control | Generates summary metrics and HTML reports for each run and sample, including key QC indicators like median UMI counts per cell, median genes per cell, and sequencing saturation. |
 Ingestion
After preprocessing, HISE moves Cell Ranger outputs, such as filtered matrices, metrics, and web summary, into a watchfolder. This automated pipeline process triggers ingestion of the files into the associated Project Store. During ingestion, HISE attaches sample metadata to the files for transparent downstream analysis and tracking.
Table 2 summarizes the output files HISE creates during ingestion. Not all files are generated on every run.
Table 2: Output files
| File Type | Example File Name | Content/Purpose | ||
| Web summary | web_summary.html | Interactive HTML report for QC and metrics review | ||
| Gene expression matrix | filtered_feature_bc_matrix.h5 | Cell-by-gene expression matrix (raw and filtered) | ||
| Feature-barcode matrix | filtered_feature_bc_matrix.h5 | Matrix that includes gene expression and feature barcodes | ||
| Metrics summary | metrics_summary.csv | Run- and sample-level QC metrics | ||
| BAM file | possorted_genome_bam.bam | Aligned reads with cell barcode and UMI tags | ||
| Cloupe file | new-cloupe.cloupe | Visualization in the 10x Genomics Loupe browser |
Web summary file
Let's take a closer look at the Cell Ranger multi QC web summary, the most comprehensive of these output files. This detailed report includes sequencing metrics, mapping rates and distribution, cell calling metrics, and quality indicators, as shown in the accompanying sample report. Scroll down for an explanation of each item marked in the sample.
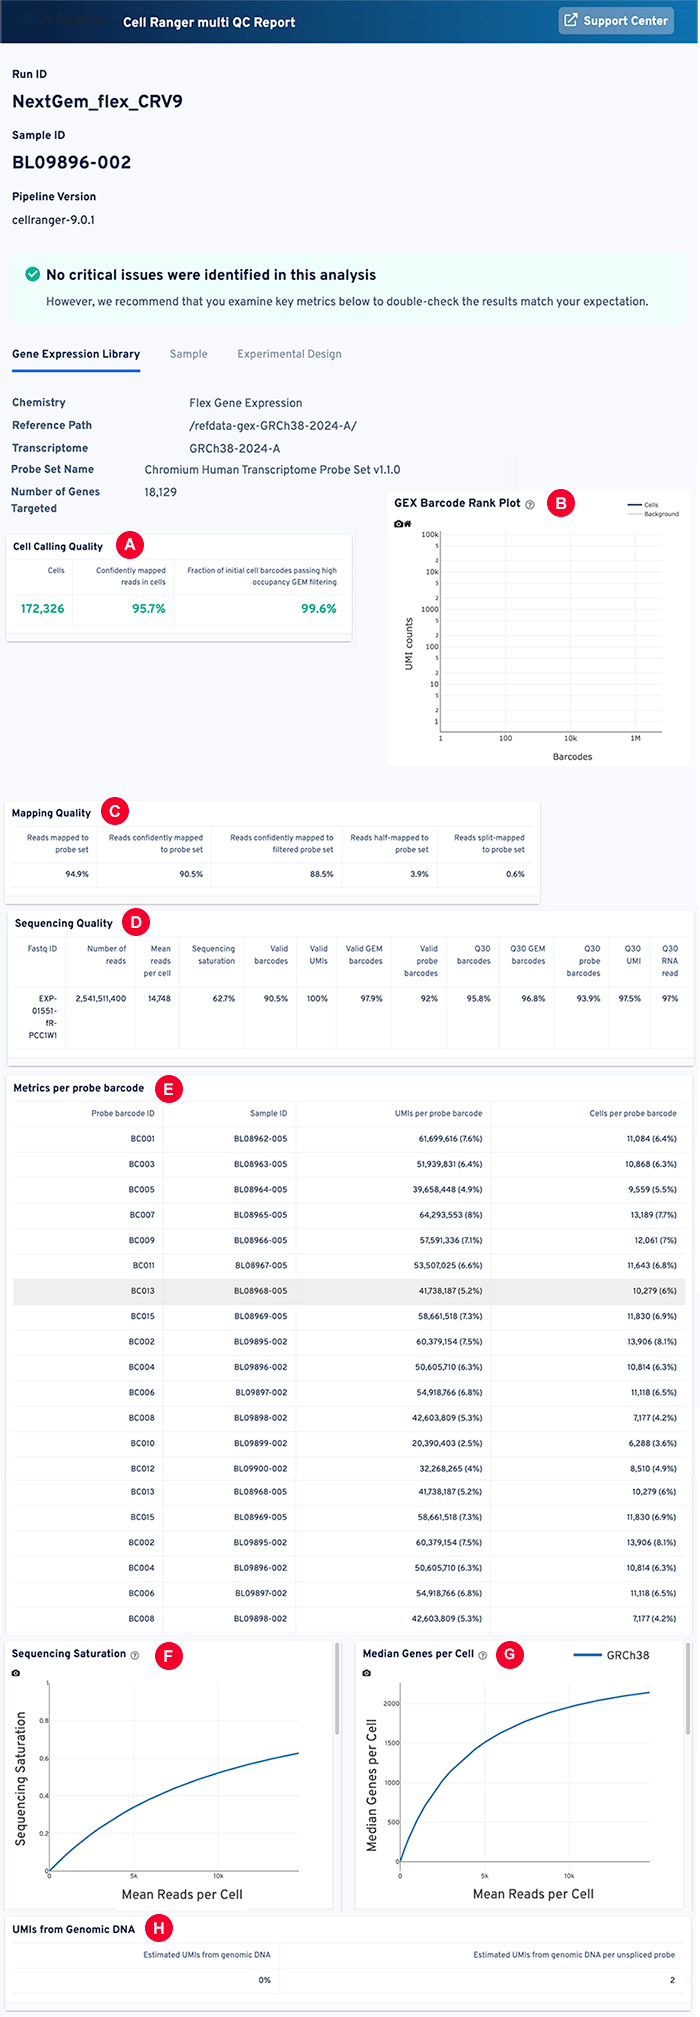
A: Web summary file: Cell calling quality
| Metric | Description |
| Estimated number of cells | The number of cell barcodes identified as true cells. Matches expected cell recovery (for example, 10,000 cells for Chromium X). |
| Confidently mapped reads in cells | Percentage of reads confidently mapped to the genome and associated with valid cell barcodes. Indicates successful cell capture and sequencing. |
| Fraction of initial cell barcodes passing high occupancy GEM filtering | Fraction of barcodes retained after excluding low-occupancy GEMs (likely empty droplets or debris). Measures sample quality and cell viability. |
B: Web summary file: GEX barcode rank plot
A GEX barcode rank plot visualizes the quality of cell calling by distinguishing cell-containing droplets from empty droplets or background noise. The X axis ranks barcodes by UMI count, and the Y axis shows the log-transformed UMI counts per barcode. Blue indicates barcodes classified as cells, whereas gray identifies background (non-cell) barcodes.
C: Mapping quality
| Metric | Description | Value or Range |
| Reads mapped to probe set | Percentage of reads that align to any probe in the probe set, regardless of confidence. | >90% rate of alignment |
| Reads confidently mapped to probe set | Percentage of reads that confidently align to a probe in the filtered (high-quality, non-ambiguous) probe set. | 60%–70% of total reads |
| Reads confidently mapped to filtered probe set | A subset of probes that meet quality and specificity standards. | 50%–65% of total reads |
| Reads half-mapped to probe set | Reads that partially align to a probe (one end/portion matches, but not the full read). | Typically low (<5%) |
| Reads split-mapped to probe set | Reads that align to two non-contiguous regions of a probe, indicating possible splicing or artifacts. | Typically very low (<1%) |
D: Web summary file: Sequencing quality
| Metric | Description | Value or Range |
| Fastq ID | Identifier assigned to FASTQ files, which contain raw sequencing reads. | Variable |
| Number of reads | Total number of reads generated by the sequencer. | Depends on the experiment |
| Mean reads per cell | Average number of sequencing reads assigned to each cell. To calculate this figure, divide the total number of reads mapped to cells by the number of cells identified. Deep profiling requires more than 50,000 reads per cell. | 50,000–100,000 |
| Sequencing saturation | Fraction of reads from duplicate UMIs, indicating sufficiency of sequencing depth. The higher the saturation, the lower the likelihood that additional sequencing will yield new information (unique transcripts). | 90%–95% |
| Valid barcodes | Percentage of reads with recognized cell barcodes. A barcode is valid if it appears on a list of known, predefined barcode sequences for the specified assay, has no sequencing errors or ambiguous bases, and is the correct length and format. | 95%–99% |
| Valid UMIs | Percentage of error-free UMIs that match expected patterns. | 80%–95% |
| Valid GEM barcodes | Percentage of allow-listed, error-free GEM barcodes. | 90%–98% |
| Valid probe barcodes | Percentage of error-free probe barcodes that match designated sequences. | 85%–95% |
| Q30 barcodes | Percentage of barcode bases with a Phred quality score greater than or equal to 30 (99.9% accuracy). | >85% |
| Q30 GEM barcodes | Percentage of GEM barcode bases with Q30 scores. | >85% |
| Q30 probe barcodes | Percentage of probe barcode bases with Q30 scores. | >85% |
| Q30 UMI | Percentage of UMI bases with Q30 scores. | >85% |
| Q30 RNA read | Percentage of RNA read bases with Q30 scores. | >85% |
E: Web summary file: Metrics per probe barcode
| Column | Description | Example Values |
| Probe barcode ID | Unique identifier for each probe barcode sequence. Used to tag and identify specific probes. | PB0001, PB0002 |
| Sample ID | Identifier for the biological sample or library from which the data was generated. | Sample_01, Patient_A |
| UMIs per probe barcode | Number of UMIs for each probe barcode. Represents the number of unique transcript molecules detected by that probe. | 15, 120, 300 |
| Cells per probe barcode | Number of cells in which each probe barcode was detected. | 10, 45, 200 |
F: Web summary file: Sequencing saturation visualization
The sequencing saturation visualization shows the relationship between sequencing depth and transcript detection efficiency. The curve rises steeply and then plateaus as saturation nears 100%.
G: Web summary file: Median genes per cell visualization
This figure offers a visual and numeric summary of the median number of genes detected per cell-associated barcode. It shows the median value of the number of genes detected across all cells in the dataset. This value reflects the complexity of the cell sample, with higher values indicating more genes detected per cell.
H: Web summary file: UMIs from Genomic DNA
High UMI diversity means high library complexity and good genome sampling. This visualization shows the molecular count and the number of unique UMIs. It distinguishes between biological molecules and PCR duplicates. After sequencing, reads with the same UMI that map to the same genomic location are considered PCR duplicates and are collapsed into a single consensus read.
 Exploration
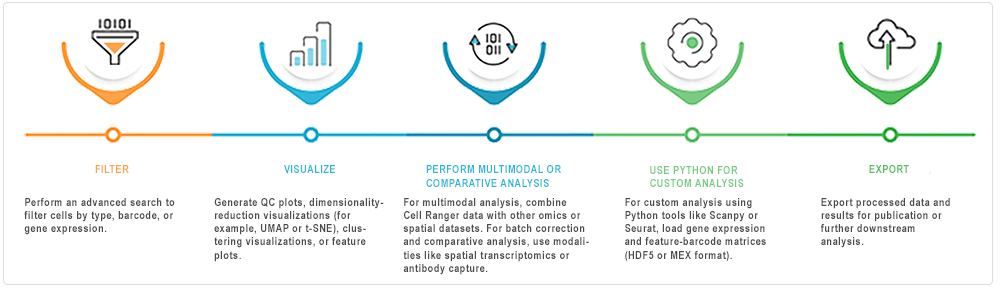
After ingestion into HISE, you can analyze the Cell Ranger pipeline outputs interactively in an IDE (Jupyter Notebook). The accompanying image offers suggestions for exploring the data.
 Related Resources
Configure a Pipeline (Tutorial)