Track Your IDE Billing Expenses (Tutorial)
 | Abbreviations Key |
| AIFI | Allen Institute for Immunology |
| CPU | central processing unit |
| GB | gigabyte |
| HISE | Human Immune System Explorer |
| IDE | integrated development environment |
| USD | U.S. dollars |
At a Glance
This document explains how to track your personal IDE expenses. To minimize cloud billing expenses, you should periodically compare your actual usage to your individual and team quotas.
Cloud Computing Components
You incur cloud computing costs when you use HISE IDEs to store and process data. Even a stopped IDE incurs costs. Specific items that contribute to your monthly computing expenses include the following:
| Item | Costs based on |
| CPUs | Processing time (sec) in a running instance |
| Data-disk storage | Amount of provisioned space (GB), even if the storage is unused or the instance is stopped |
| Memory | Amount of memory allocated to a running instance (GB/sec) |
Best Practices for Efficient IDEs
Cloud computing costs are tracked at the personal (individual) and organizational (team or partner) levels. For details, see Get Started with HISE. To minimize expenses, use the available cost management tools outlined here, and follow these best practices:
Stop IDE instances when possible. Stopped instances incur cloud computing costs only for disk space—not for CPUs or memory.
Delete idle instances when they're no longer needed. Google storage buckets cost less than disk storage in the IDE.
- If you're an administrator, follow the principle of least privilege, granting permission to access cloud resources only to those who need it.
For detailed cost management advice from Google, see the recommendations in Monitor and Control Cost. For questions about your individual or organizational quotas, contact your billing administrator or email immunology-support@alleninstitute.org.
IDE Billing
A quota is the maximum amount (in USD) an individual or organization is allowed to spend on cloud computing within a given time period. To monitor your team's quota, read your email notifications, and compare your personal IDE spending with the median team spending.
HISE users are notified by email as they approach various individual and team monthly caps. For example, you're notified by email when you reach 50% of your monthly quota. If you max out your monthly quota, you can't start a new IDE instance. In addition, any running instances are stopped, and active notebook jobs are canceled and returned to the queue, where they remain until the following month.
Instructions
To track your usage and compare it with that of other IDE users on your team, follow the steps below.
1. Navigate to HISE, and use your organizational email address to sign in.
2. Choose the accounts whose expenses you want to see. For instructions, see Understand and View Accounts and Projects (Tutorial).
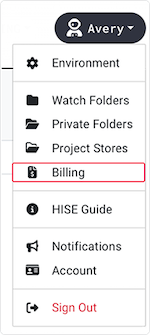
3. In the upper-right corner of your screen, click your name.
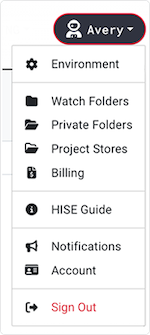
4. From the drop-down menu, choose Billing.
5. On the Billing page, click the Personal IDE Billing tab.
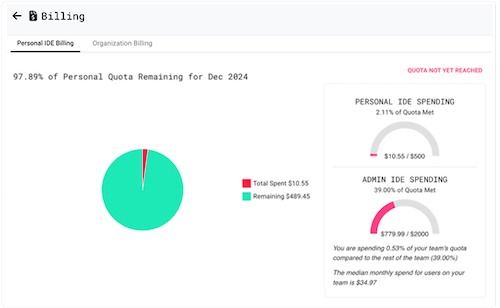
A. To compare your actual spending with your monthly quota (USD), review the PERSONAL IDE SPENDING graphic. The preceding example shows that so far this month, $10.55 (2.11%) of the user's monthly $500 quota has been spent.
B. To compare your team's actual expenses with its monthly quota (USD), review the ADMIN IDE SPENDING graphic. The preceding example shows that the user's team or partner (ADMIN) has spent $779.99 of its monthly $2,000 quota.
C. To learn what percentage of the team's quota you've spent (in this case, 0.53%), as well as review the median monthly expenses for individual team members (in this case, $34.97), see the explanation below the ADMIN IDE SPENDING graphic.
6. Stay on the Personal IDE Billing tab, and scroll to the next section, Personal Spend by IDE Instance.
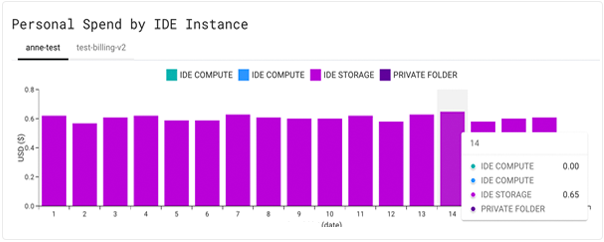
A. To see expenses for each of your IDEs, click the tabs, such as anne-test.
B. To see the expenses incurred by your private folder, click the private-folder tab (not pictured).
C. To see a breakdown of expenses for a given date, hover over the specified date along the horizontal axis.
7. Stay on the Personal IDE Billing tab, and scroll to the next section, Total Personal vs. Median Partner Spending for the Last [X] Months.
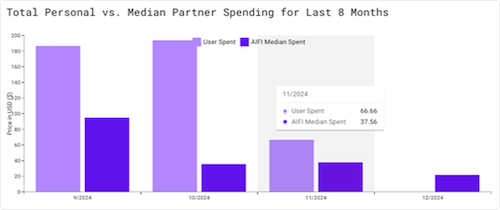
The chart shows 12 months of billing data unless you've used HISE for < 1 year. For example, this user has used HISE for only 8 months. |
A. To compare your spending with the median amount spent by members of your team, review the bar chart.
B. To see the rough amount (USD) of your spending, look at the vertical axis.
C. For the precise dollar amount of spending in a single month, hover over the selected month. This user, for example, spent $66.66 in November, compared with median team spending of $37.56 the same month.
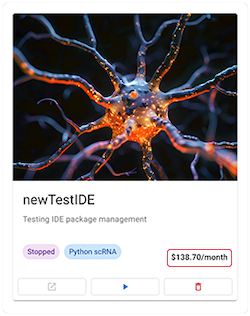
8. An alternative way to track IDE spending by instance is to go directly to the IDE:
A. From the top navigation menu in HISE, click RESEARCH.
B. From the drop-down menu, choose NextGen IDE.
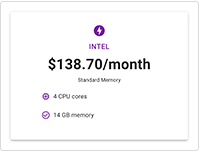
C. In the lower-right corner of the card for each running or stopped IDE, note the monthly spending (in this case, $138.70), or click the card for details.
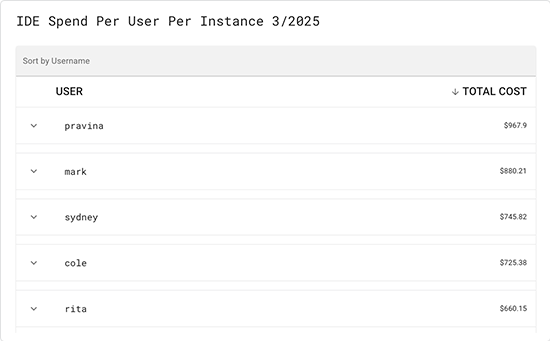
9. Scroll to IDE Spend Per User Per Instance:
A. To sort the list by username, click USER (left column).
B. To sort the list by dollar amount, click TOTAL COST (right column).
 Related Resources
Open a Workspace to Re-Execute a Certificate of Reproducibility (Tutorial)
Manage NextGen IDE Instances (Tutorial)