Save Visualizations in HISE (Tutorial)
Last updated 2026-06-08At a Glance
With the HISE SDK, you can save two kinds of results—simple Plotly figures or full visualization apps—into a study, where you and your collaborators can reuse them as templates.
Use
save_visualization()to save a single Plotly figure.Use
save_visualization_app()to upload and deploy a HISE visualization app using a Pixi-based build template (for example, Dash or Deck.gl).
NOTE: Visualization builds in HISE now use Pixi as the package and environment manager.
Once saved, your visualization appears in the study’s Visualizations tab in the HISE Collaboration Space, so you can find and share it. If you have questions or need help, contact Support .
When to Use This Feature
Use this feature when you want to create a visualization in a HISE IDE and then save, deploy, or share it:
Share it with others by saving it directly into a study as a saved visualization.
Capture the code, environment, and inputs used to generate the visualization so others can reproduce or extend your work.
Then follow the path that matches your use case.
Path 1: Save a Plotly visualization with
save_visualization(). Use this path when you’ve already created a single Plotly figure (Python or R) that you want to save as a saved visualization in a study, and you don’t need a full app experience.Path 2: Save a visualization app with
save_visualization_app(). Use this path when your result is an interactive app (for example, Dash or Deck.gl) that HISE builds and serves using a Pixi-based visualization build template.
NOTE
The terminology surrounding HISE visualizations can be a little confusing, so let's define some important terms:
Saved visualization
We use saved visualization to mean an asset you can open from the Visualizations link in the side navigation of your study.
Visualization build template
We use visualization build template to mean the configuration HISE applies to build and deploy your visualization app.
Instructions
Prepare your visualization in an IDE
Load your data and generate a visualization in an IDE, according to the needs of your study.
A. For simple visualizations, create a Plotly figure.
i. To make sure your code runs end to end in the IDE, run the following code in a new IDE cell:fig.show()
ii. To save the visualization, store it in a Plotly figure object to pass in later, as shown in the following example:fig = px.scatter(
x=[1, 2, 3, 4],
y=[10, 15, 13, 20],
title="Plotly example"
)B. For complex visualizations, build an app (for example, a Deck.gl app) in your IDE workspace (for example,
/home/workspace).
Create and save a hero image
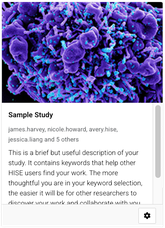
Each saved visualization in HISE includes a static image visible to users who are browsing among the saved visualizations.
From your IDE, export or otherwise save a PNG that represents your visualization (for example, a Plotly figure export or a screenshot of your app’s main view).
Save the image somewhere in your IDE workspace (for example,
/home/workspace), so the SDK can access it.
Call the SDK
Path 1: Save a Plotly visualization As a starting point, you can use the sample Plotly notebooks in the /examples folder in your IDE.
Import the HISE SDK module.
import hisepy as hpImport Plotly Express.
import plotly.express as pxConfirm and note the file path to this PNG. You’ll need this path later, when you make the SDK call to save the visualization.
fig.write_image("/home/workspace/example-plot.png")Call the SDK. Call
save_visualization()with its required and optional parameters. The SDK saves your Plotly figure into the selected study as a saved visualization. HISE links that saved visualization to the IDE run that produced it, including input data, code, and environment.hp.save_visualization(figure=fig, study_space_id="12345678-1234-1234-1234-123456789abc",title="Example Plotly visualization",png_image="/home/workspace/example-plot.png")
Path 2: Save a visualization app Use this path when you’ve built an app (for example, using Deck.gl or Dash) and want HISE to build and deploy it using a visualization build template.
Note your file path. Place your app files and directories in a location HISE can package. You’ll pass in these file and directory paths to
save_visualization_app()./home/workspace/my-appInclude your app’s main entry point and any required framework or server files, such as
app.py,package.json, or other server entry files.Include your Pixi environment file and any other required app configuration files or scripts. In Pixi-based IDEs,
save_visualizations_app()uses your Pixi environment file so you don't have to define dependencies separately. Don't userequirements.txtto define your dependencies for Pixi-based visualization builds.Do not include large input data files. Instead, upload those separately to your study space for your app to use when you run it.
Capture your input file IDs. Before you call
save_visualization_app(), save your input data files in HISE, since the app must read from those files.If your app uses files already present in your study space, capture their file IDs from HISE and have them ready to pass in.
If your app uses files generated in the IDE that aren’t yet in HISE, upload them using the
upload_files()(Python) |uploadFiles()(R) SDK method, and wait until those files become available.Collect the file IDs you want to include in your app, and keep them in a list. Pass this list to the
data_source_file_idsparameter.Select the data mount path. Choose a path (for example
/dataor/input) as the directory in which your input data is stored, so your app can read it at runtime. You pass in this path as thedata_mount_pathargument. If you forget the leading/, HISE adds it for you.Import the HISE SDK module.
import hisepy as hpCall the SDK. Call
save_visualization_app()with the required parameters. For Pixi-based visualization builds, include your app entry point and your Pixi manifest file, such aspixi.toml.
hp.save_visualization_app(study_space_id=study_space_id,
app_name="my-app",
application_files=[
"/home/workspace/my-app/app.py"
],
data_source_file_ids=data_source_file_ids,
)
(Optional) If you already know which visualization build template you want to use, such as
Dash with Pixi, without pre-installed packages (v3.0), you can also pass in the following additional parameters:
i.build_template_name
ii.build_template_major_version
iii.build_template_minor_version
iv.build_template_parameters/* A map of framework-specific arguments, such as app entrypoint paths, which must match the build variables for that visualization build template */
v.infer_build_template_arguments/* Parameter that tells HISE whether to infer framework-specific arguments from your files and directories if you don’t supply them directly */
Thesave_visualization_app()SDK then packages your app files, applies the selected visualization build template, and starts a build workflow to deploy your app. It also creates a saved visualization in your study that points to the deployed app.
Review the saved visualization in HISE
Find the saved visualization and share it with your team.
From the top navigation menu, click COLLABORATION SPACE.

Click the card that represents your study.
In the side navigation menu, click Visualizations.
Find the card for your saved visualization, identified by its hero image, and click to open it.
Review your saved Plotly figure or app-based visualization in Draft mode.
If you like, confirm the output with your collaborators. For instructions on adding collaborators to your study, see Work with Studies (Tutorial) . When you're satisfied with the saved visualization, mark it as Final.