Last modified 2026-02-19 |
Develop Dash Apps
 | Abbreviations Key |
.bw | bigWig [file format] |
| HISE | Human Immune System Explorer |
| IDE | integrated development environment |
| IGV | integrative genomics viewer |
| SDK | software development kit |
At a Glance
Dash is a versatile Python library that lets you build interactive web application dashboards. Dash abstracts away the technologies and protocols required to build a full-stack web app with interactive data visualization. Dash is simple enough to bind a user interface to your code efficiently.
When to Use This SDK
Use a Dash app to create a file set in the following cases:
- To publish the notebook that handles the processing step, you should save the input files as a file set. This isn't required, but it's a best practice to preserve traceability.
- To share the output files from your processing step, save the output as a file set. Doing so allows other users to skip processing and proceed directly to building visualizations or other tools.
Instructions
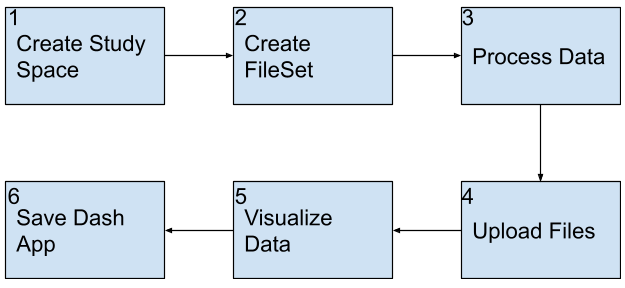
Follow these steps when you have a finished Dash app you want upload and publicize.
Instructions
 Create study space
Create a study to house your Dash application.
1. Navigate to HISE, and use your organizational email address to sign in.
2. From the top navigation menu, select COLLABORATION SPACE.

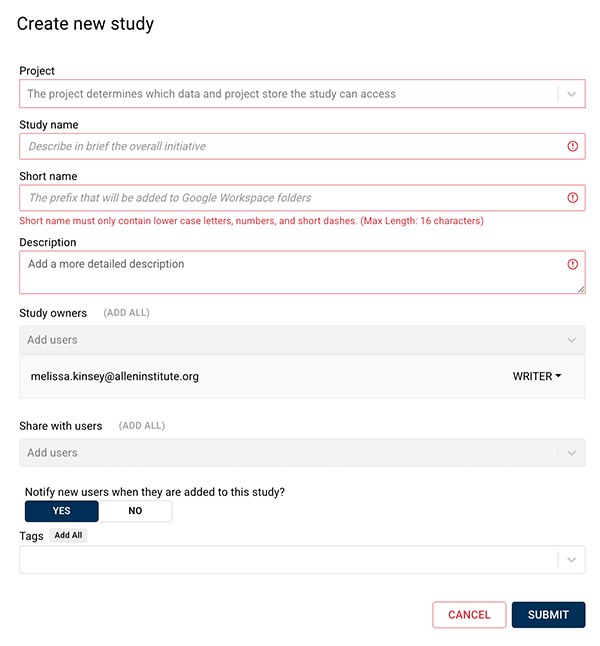
3. In the upper-right corner, click CREATE STUDY.

4. In the Create new study dialog box, complete the requested information. For details, see Work with Studies (Tutorial).
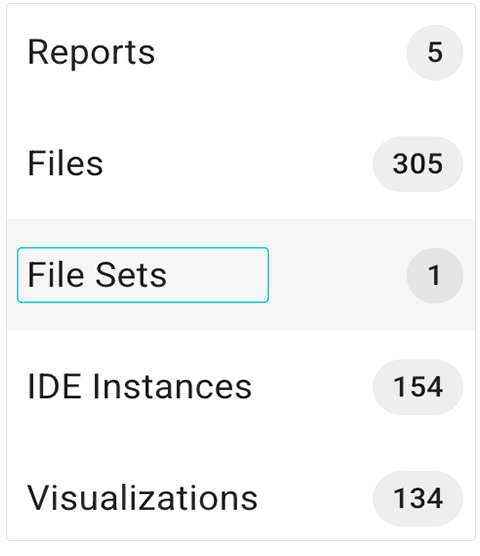
 Create file set
1. Create a file set. For details, follow the instructions in Step 1 of Work with File Sets (Tutorial).
 Process data
1. Use code or a notebook to read data from HISE and perform any required transformations or computations on the original dataset(s). (Do not include code that builds or runs a Dash app in this step. )
Even though this step doesn’t take a file set as input, we recommend creating one to store your processed data and make your results shareable. If you plan to publish your notebook, remove any HISE-specific function calls first. In that case, you can download your file set from HISE and load it directly into your notebook instead. |
 Upload files
1. To save key results to a study and create a complete, traceable record, call upload_files() within the root directory of your app.py file. For details, see Save Your Input File or File Set to a Study (Tutorial).
 Visualize data
To develop your Dash app, create an app.py script. With some exceptions, any processing that takes a significant amount of time shouldn't be included in your app. When building a Dash app in an IDE such as JupyterLab, use the JupyterDash library. JupyterDash helps you create and run Dash apps directly within a Jupyter notebook. To see a working example of a Dash app built in a notebook, refer to the Develop Dash App example notebook in the IDE /examples directory.
1. Use the following import statements to set up your app:
# Dash for Jupyter + setting up proxy
from jupyter_dash.comms import _send_jupyter_config_comm_request # Jupyter only
_send_jupyter_config_comm_request() # Jupyter only
from jupyter_dash import JupyterDash # Jupyter only
jupyterdash.infer_jupyter_proxy_config() # Jupyter only
jupyterdash.infer_jupyter_proxy_config() # Jupyter only
When developing within the HISE IDE, replace
|
2. Before you call save_dash_app(), we strongly recommend that you clean up your working directory and remove any unused scripts or data. When you make a save_dash_app() call, the UI prompts you to select the files that are a part of your app. By default, everything in your working directory is listed, including subdirectories and their files. So cleaning up your working directory facilitates the selection process.
Use the following checklist to clean up your working directory: Script that generates the Dash app is named Any additional scripts that are a part of your app are included Working directory contains a single .png image Style sheet has been saved in All code in the |
 Save Dash app
This section shows you how to use save_dash_app. Currently this method is only supported in Python and has no R equivalent.
1. To save your dash app to a study, use the save_dash_app() SDK function and one of our customized widgets: SaveDashWidget. Run the following in an IDE cell block:save_result = SaveDashAppWidget()
2. Add an IGV genome browser to your app. In your layout, create a dashbio.igv component, set the genome parameter to a predefined IGV-hosted genome, and add any tracks you want to visualize (annotations, variants, alignments, or quantitative data).
|
3. To add your own tracks, define a Flask route that serves IGV data files, and use that route as the track URL.
Like other Python packages, Plotly Dash extends Flask. Flask is a Python micro web framework. After initializing the Dash class with |
A. Routes decorator. Add a route that serves files from the IGV directory.
@server.route(f"{app.config.url_base_pathname}igv/<path:fname>")

def send_file(fname):

     return send_from_directory("/home/jupyter/igv/", fname)
The function returns the requested file from /home/jupyter/igv using send_from_directory, which safely serves files from inside that folder.
B. Proxy URL (URL_BASE_PATHNAME). When you run locally or in a HISE IDE, URL_BASE_PATHNAME is usually None, so the route is essentially /igv/<fname>. To save your dash app via hp.save_dash_app(), set URL_BASE_PATHNAME (for example, /my-app/) so that the route becomes /my-app/igv/<fname> and matches how your app is proxied.
|
 Related Resources